NBA Implied Probability: Betting Odds Conversion
 Available in US
The single most useful skill I ever developed as an NBA bettor is something my old maths teacher could have taught me in a single afternoon. Take a decimal price. Divide one by it. That is the bookmaker’s view of the world, expressed as a percentage. I have spent nine years staring at NBA odds, and every meaningful bet I have ever placed started with that one calculation.
The reason implied probability matters so much is that no other number on the screen tells you what the bookmaker actually thinks. The price tells you what they pay. The implied probability tells you why they pay it. And once you can compare that implied probability to your own honest read of a matchup, you stop being a punter who picks teams and start being a punter who picks discrepancies.
Mathematical Conversion of Decimal Odds
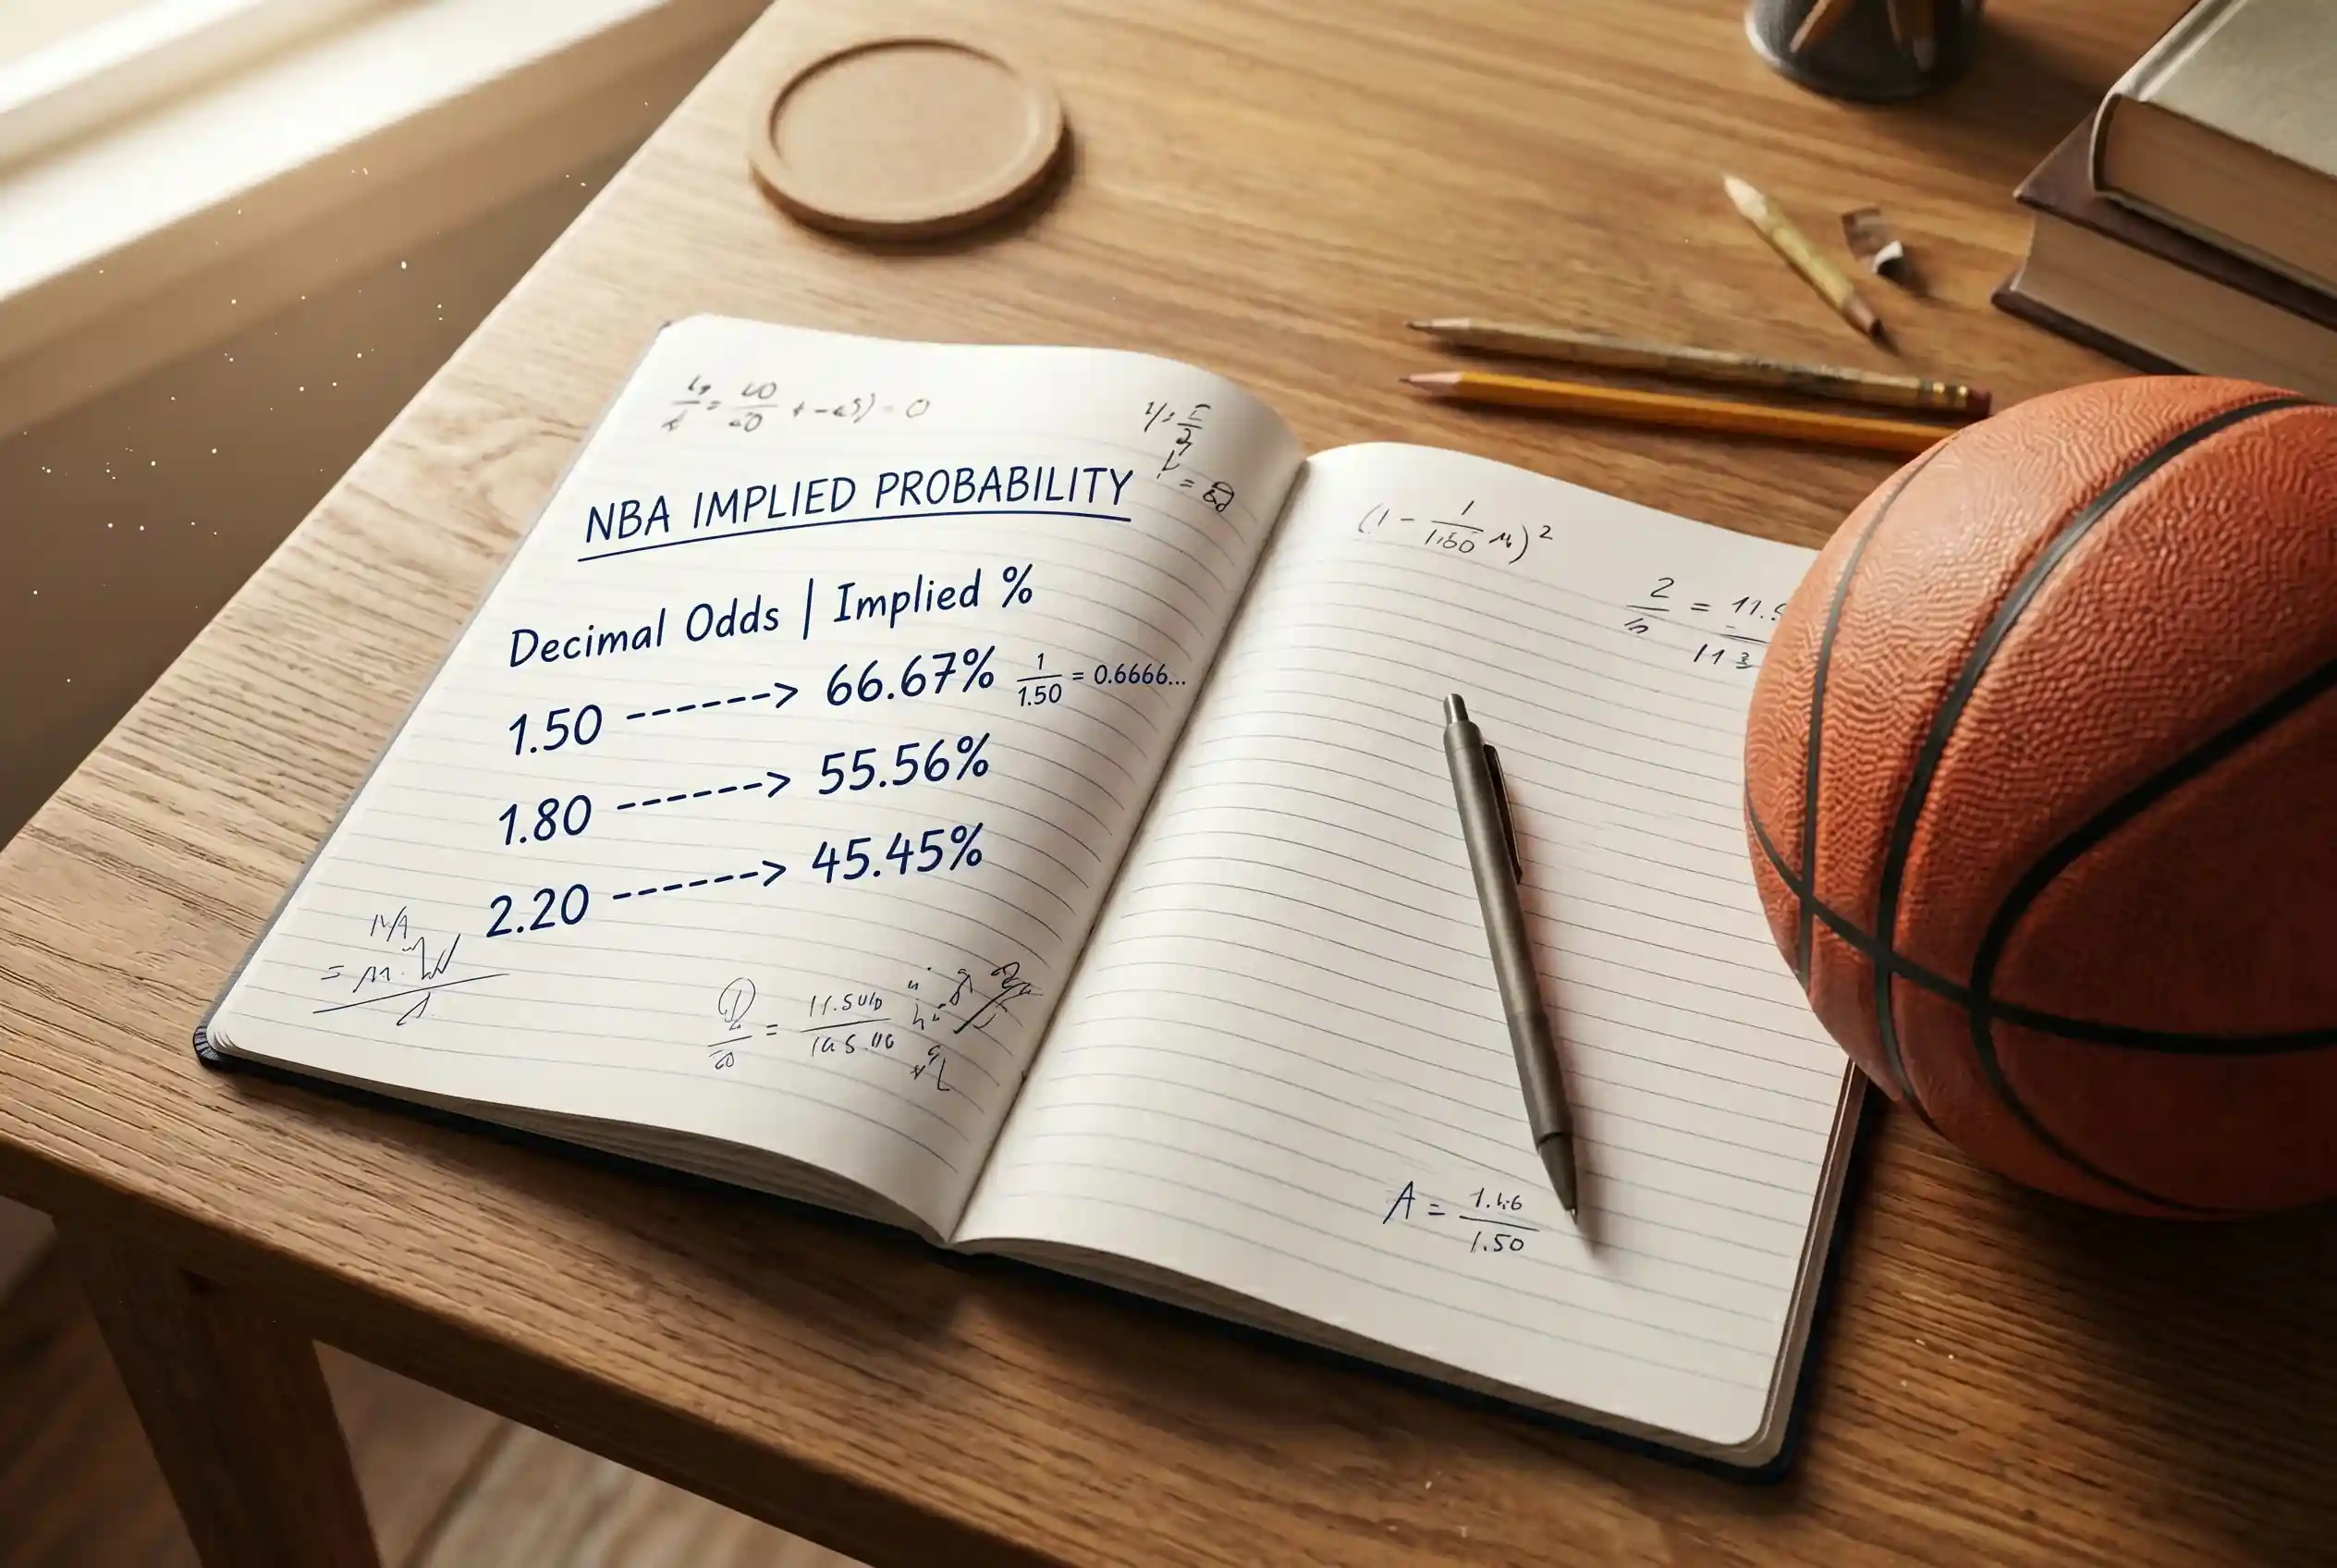
I keep a small index card in my desk drawer with about a dozen decimal prices and their implied probabilities written out. 1.50 is 66.67 percent. 1.80 is 55.56 percent. 1.91 is 52.36 percent. 2.00 is 50.00 percent flat. 2.20 is 45.45 percent. 3.00 is 33.33 percent. 4.00 is 25.00 percent. 5.00 is 20.00 percent. After two seasons of glancing at the card, I no longer need it – the conversion runs in the background while I scroll.
The formula is one divided by the decimal price, multiplied by 100 if you want a percentage instead of a decimal. On a 1.91 line, 1 / 1.91 = 0.5236, or 52.36 percent. That is the bookmaker saying, “I think this side wins about 52.4 percent of the time, and I am charging you a small surcharge on top of that.” The surcharge is the part you fight against. The 52.36 percent is the part you have to beat.
You will sometimes hear American bettors give the same number in moneyline form. A US -110 line carries an implied probability of 52.38 percent. A UK 1.91 line carries an implied probability of 52.36 percent. The two-pence rounding difference is meaningless. What matters is that you are looking at the same probability statement dressed in two different costumes, and the UK costume is faster to read.
Once you can do this on every NBA price the screen shows you, the next question becomes obvious. The bookmaker is offering a probability. Your job is to have an opinion about whether that probability is right.
Removing the Bookmaker’s Margin
Here is where most casual UK punters get tripped up. A 1.91 line does not actually represent the bookmaker’s true 52.36 percent view. It represents 52.36 percent inclusive of margin. If the other side of the bet is also priced at 1.91, both implied probabilities add up to 104.72 percent. That extra 4.72 percent is the overround – money that the bookmaker keeps if their pricing is otherwise neutral.
To find the no-vig fair line – what the book genuinely thinks the probability is – you devig. The math is a clean two-step. Compute the implied probability on both sides. Then divide each by the sum of the two. On the symmetric 1.91/1.91 example, both sides devig to 50.00 percent exactly. That is the book’s honest projection.
It gets more interesting when the line is uneven. Say the Bucks moneyline is 1.50 (66.67 percent) and the Pistons moneyline is 2.70 (37.04 percent). Sum: 103.71 percent. Devigged Bucks: 66.67 / 103.71 = 64.28 percent. Devigged Pistons: 37.04 / 103.71 = 35.72 percent. The book is saying the Bucks win this matchup roughly 64 times out of 100, and they are charging you about 3.7 percent margin for the privilege of acting on that view.
The reason this matters more than the raw price: the no-vig fair line is what you compare your personal projection against. If you have done the work – pace, lineup, rest, the schedule slot – and your honest read is the Bucks should win this 70 percent of the time, you are 5.7 percentage points ahead of the no-vig market. That is a genuine edge. It is not the 3.3 percentage points above the raw 66.67 percent implied – that comparison ignores the vig and overstates your advantage.
Sports betting globally is on track for $187.39 billion by 2030, growing at 11 percent a year, and the operator margins funding that growth come straight from punters who never bothered to devig.
Three Real NBA Line Examples
Let me run three concrete walkthroughs that mirror what I see on a typical Wednesday night UK NBA card.
First, a tight Eastern Conference matchup. Heat at 1.85, Bulls at 2.05. Implied probabilities: 54.05 percent and 48.78 percent. Sum: 102.83 percent – a relatively skinny 2.83 percent margin, which is what you would expect from a competitive primetime game on a popular book. Devigged: Heat 52.56 percent, Bulls 47.44 percent. The market is calling this game a near coin flip with a slight Heat lean.
Second, a heavy favourite. Celtics at 1.30, Wizards at 3.80. Implied: 76.92 percent and 26.32 percent. Sum: 103.24 percent. Devigged: Celtics 74.51 percent, Wizards 25.49 percent. The book is telling you Boston wins this three games out of four, and the small underdog price exists not as a value play but as a placeholder for the rare bad night.
Third, a player prop. The line for Anthony Davis points over 24.5 is 1.95; under 24.5 is 1.80. Implied: 51.28 percent and 55.56 percent. Sum: 106.84 percent – a noticeably fatter prop margin, around 6.84 percent. Devigged: over 47.99 percent, under 52.01 percent. The book is saying the under is genuinely slightly favoured, and you are paying nearly 7 percent juice to play either side. Basketball makes up roughly 14.2 percent of online sports-betting revenue worldwide, and props are the chunk where operators recoup the most margin per pound risked.
What unites these three examples is that every interpretation starts with the same one-over-decimal step. The complexity is in what you do after that.
How an Expert Uses Implied Probability Daily
By the time I am scrolling an NBA card on a Tuesday evening, I have already run my own projections on the games I care about. I know roughly where I think the spread should sit, what total feels right, and which player props look mispriced based on the rotation and pace. The decimal-to-probability conversion is what turns “feels right” into a number that argues with the screen.
My quick check is the gap test. If my projected probability is more than three percentage points clear of the devigged no-vig fair line, the bet is worth a hard look. Two to three percentage points is borderline – I will look but rarely fire unless the matchup gives me a specific reason. Anything under two percentage points and I close the tab. Most NBA nights, the gap test eliminates 90 percent of the card before I have even considered staking.
The other daily use is sanity-checking parlays. Multiply the devigged probabilities of every leg, and you have your true expected win rate on the slip. If you have built a three-leg parlay where each leg is 60 percent likely to land independently, the combined probability is 21.6 percent – and the parlay needs to pay better than 4.63 to be a fair bet. Once you start doing this, the appeal of long accumulator slips fades quickly.
The next layer of this – comparing the price you took to the price the line closed at – is closing line value, and it is the only metric I trust to tell me whether my reads are actually sharp.
One divided by the decimal price. That is the entire formula. Multiply by 100 if you want a percentage instead of a decimal. Once you have done it twenty times on real NBA lines, the conversion happens automatically and you stop needing a calculator. Yes. The raw implied probability includes the bookmaker’s margin, which inflates the apparent probability of every outcome. Devigging – dividing each side’s implied probability by the sum of both sides – gives you the bookmaker’s honest projection, and that is the number your own read needs to beat.What is the easiest way to remember the implied probability formula?
Should I always devig before deciding a bet is value?
Prepared by the nba Betting Expert editorial staff.