
NBA Playoff Series Betting UK: Matchup Pricing
 Available in US
Table of Contents
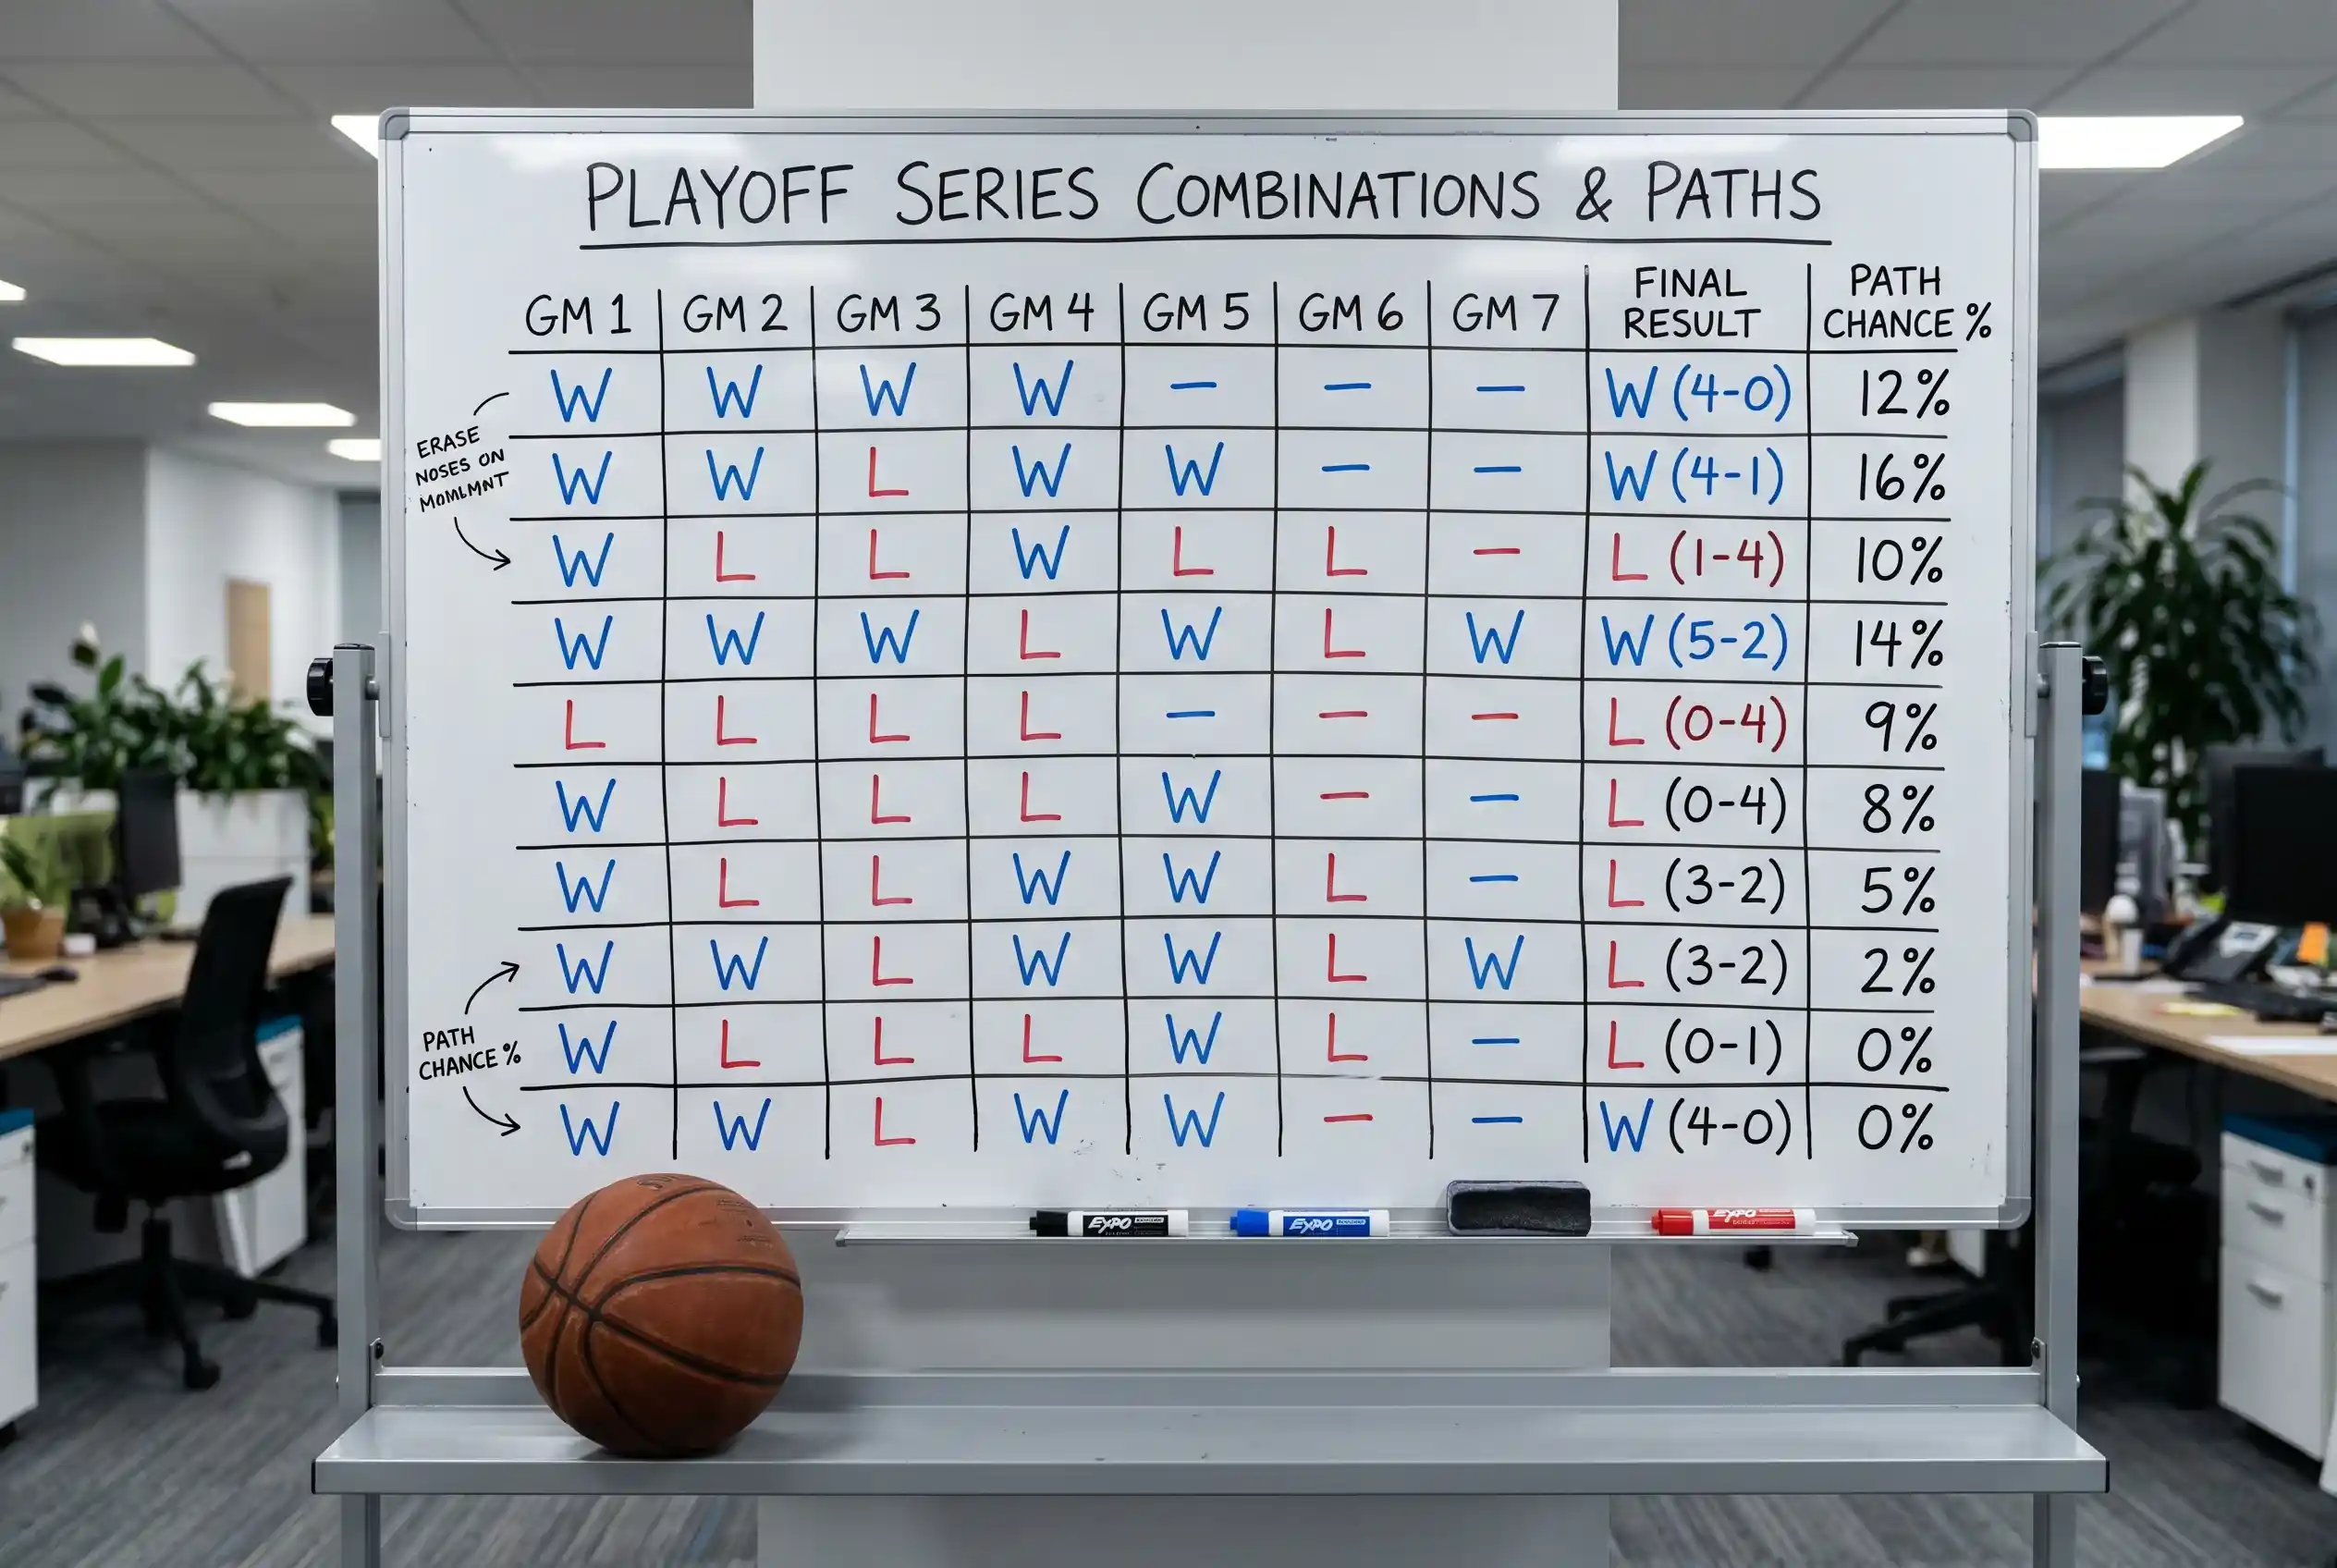
The first time I tried to back-solve a playoff series price, I sat at my kitchen table for nearly two hours with a pen, a notepad, and a half-built spreadsheet. The book had a series moneyline of 1.40 on the higher seed, a 4-2 correct score at 4.50, and a series-to-go-six-games price at 3.75. None of the three prices were obviously consistent with each other, and figuring out which one offered the best implied probability for the underlying outcome I was trying to bet took serious math. That afternoon taught me that playoff series markets are not three independent products – they are three views of the same probability distribution, and the gaps between them are where value lives.
Series pricing in the NBA playoffs is the most analytically complex product on the regular UK NBA betting board. The book has built a probabilistic model of how the series can unfold, and they offer multiple bets that each capture different slices of that distribution. Understanding the structure lets the UK bettor identify the slices where the book has under-priced or over-priced relative to genuine probability.
Analyzing the Three Layers of Playoff Series Betting
Every UK-licensed sportsbook offers three primary playoff series markets: series winner moneyline, correct score, and series length. They share underlying probability mechanics but express them differently.
The series moneyline is the simplest. A team wins the series in some combination of four to seven games, or they lose. The price reflects the book’s estimate of the team’s probability of winning the series regardless of how it plays out. A heavy series favourite might price at 1.30, with the underdog at 3.75. The implied probabilities devig to give the book’s honest estimate of each team’s series-winning chance.
The correct score market lists every possible series outcome – 4-0, 4-1, 4-2, 4-3 for each team – with a price for each. The eight possible outcomes (four sweep-or-near-sweep results for each team) sum to a total implied probability that exceeds 100 percent, with the excess representing the book’s margin across the market. Devigging the correct score gives the book’s distribution of probabilities across the possible series trajectories.
The series length market simply lists the possible numbers of games – 4, 5, 6, or 7 – with prices for each. It does not care which team wins; it cares only how long the series goes. A 4-game series has both 4-0 outcomes combined into a single probability; a 7-game series combines both 4-3 outcomes.
The three markets are mathematically linked. The probability of a team winning the series is the sum of its four correct-score outcomes. The probability of the series going seven games is the sum of both correct-score 4-3 outcomes. The series moneyline price should be consistent with the correct-score prices summed across the team’s winning outcomes. When the consistency breaks, the gap is value.
Where the Three Markets Disagree
The gaps between the three markets are not random. They reflect different recreational money flows and different book pricing models for each product.
The series moneyline attracts the most volume because it is the simplest bet to understand. The recreational money concentrates on series favourites, which compresses the favourite price below fair and inflates the underdog price above fair. A series favourite priced at 1.30 may have a devigged true probability that suggests fair price closer to 1.35; the underdog priced at 3.75 may suggest fair price closer to 3.25. The recreational money has trimmed the favourite and inflated the dog.
The correct score market attracts more analytical money and less recreational money. The casual bettor looks at the long prices on specific outcomes – 4-3 at 7.00, 4-0 at 9.00 – and finds them less appealing than the simpler moneyline. The result is that correct score prices often reflect the book’s pricing model more honestly than the moneyline does.
The series length market is the most analytically clean of the three because its outcomes do not have an obvious recreational bias. The bettor who bets the series to go six is not betting a team to win; they are betting a structural outcome. The lines on series length are typically priced tighter than either of the other two products.
The practical implication is that comparing the implied probability of a team-favouring outcome across the three markets often reveals which product offers the best value for that outcome. If you believe a series will be tight and go six games with the higher seed winning, the question is whether the 4-2 correct score price implies a better probability than constructing the same outcome through series moneyline plus series length 6.
How to Back-Solve a Correct Score
The exercise that taught me playoff series pricing in 2018 is one I still run on every series I bet. Take the eight correct-score prices. Convert each to implied probability. Sum them. Devig by dividing each by the total. The result is the book’s distribution of probabilities across the eight possible outcomes.
An example. Suppose a first-round series has the higher seed at 4-0 (5.00), 4-1 (4.00), 4-2 (5.50), 4-3 (8.00); and the underdog at 4-3 (12.00), 4-2 (15.00), 4-1 (25.00), 4-0 (50.00). Implied probabilities: 20.00, 25.00, 18.18, 12.50, 8.33, 6.67, 4.00, 2.00. Sum: 96.68 percent. That is below 100, which means the operator has set up these correct score prices with a slight built-in cushion across the favourite outcomes – unusual but worth noting. Devigging would actually push the probabilities up slightly to reach 100 percent.
More commonly the sum runs at 115 to 125 percent, meaning a 15 to 25 percent margin across the correct score board. Suppose the actual numbers come to a sum of 120 percent. Each probability divides by 120 to give the devigged figure. The higher seed’s 4-1 outcome at 25.00 percent implied devigs to 20.83 percent. That is the book’s honest probability estimate for that specific series outcome.
Once you have the eight devigged probabilities, you can compare them to your own probability estimate for each outcome. If you think 4-2 to the higher seed is genuinely a 20 percent likely scenario but the book has it at 15.15 percent devigged (the 18.18 percent implied figure divided by 1.20), the gap is your edge. That gap is what you are betting when you take the 4-2 correct score.
This is the calculation no operator advertises and no recreational bettor performs, and it is the calculation that turns correct-score betting from a casino flutter into a structurally analytical bet. The work is real, but the math is consistent across every series, and once you have done it five or six times the routine becomes fast.
Reading the Series-Length Market
The series-length market deserves its own analytical pass because it captures the playoff structure most cleanly. The four outcomes – 4, 5, 6, or 7 games – have a specific probability distribution that the book has estimated and that bettors can challenge.
The classic shape of the distribution for a competitive first-round series is roughly: 4 games at 15 percent, 5 games at 22 percent, 6 games at 30 percent, 7 games at 33 percent. The skew toward longer series reflects the fact that NBA playoff series are designed to find the better team, and most series with reasonably matched teams take six or seven games to resolve.
For a lopsided first-round series, the distribution shifts dramatically: 4 games at 35 percent, 5 games at 30 percent, 6 games at 22 percent, 7 games at 13 percent. The higher seed closes out faster when the gap is wide enough that the lower seed cannot reliably steal games on their home court.
The book prices these distributions into the series-length market, and the recreational bias here is mostly toward the 7-game outcome. Casual bettors love to bet that a series will go the distance because the headline price is long and the headline storyline is compelling. The result is that series-length 7 is often inflated above its genuine probability, and the corresponding shorter series lengths – 5 or 6 games – are often available at prices that offer better value.
The specific exploit I look for in series-length betting is the 5-game prediction in a series where the public expects a longer outcome. A first-round matchup between a 1-seed and an 8-seed often has the public betting 7 games because they believe the 8-seed has a chance to win a couple. The historical reality is that 1-8 matchups typically resolve in 4 or 5 games, with 7-game results being rare. The 5-game line in those scenarios often offers cleaner value than either the moneyline or the 4-game line.
Live or in-play wagers account for somewhere between 52 and 60 percent of all sports-betting handle in mature European markets, and the playoff series length market sees particularly heavy in-play action as games unfold and the series length probabilities update game by game.
Where Adjustment Pricing Lands Between Games
The series prices update between every game in the series. A 1-1 series after two games has a different pricing structure than the same series did before Game 1. The adjustments often produce value because the book’s update model relies on probability updates that the recreational money does not always respect.
The classic case is the home team that loses Game 1 of a series they were favoured in. The book updates their series price upward – the team is less likely to win the series than they were before Game 1 – but the recreational money often piles in on the home team for Game 2 because the public believes the home crowd will produce a bounce-back. The Game 2 spread therefore compresses below where the book’s series model would suggest, creating value on the road team’s Game 2 spread.
These adjustment-pricing patterns are most exploitable in the first two games of a series, before the market has fully priced in the new information. By Game 3 onwards, the lines tend to be efficient enough that the casual bettor’s edge has compressed.
Building a Series Position Across Multiple Markets
The most sophisticated way to bet a playoff series is to build a position across multiple markets that all express the same underlying read. If your read is that the higher seed will win 4-2, you can bet the series moneyline, the 4-2 correct score, the series-length 6, and the higher seed’s specific game lines that are most consistent with that trajectory.
The diversified position has lower variance than a single concentrated bet, because not every leg has to land for the position to profit. If the series goes 4-1 instead of 4-2, the moneyline cashes and the series-length 5 might cash if you spread that bet too, while the 4-2 correct score loses. The cumulative position can still be profitable even on outcomes that miss the specific narrative.
The trade-off is that the diversified position requires more capital and more analytical work per series. Most UK punters concentrate on a single bet per series and let it ride. The diversified approach is for the bettor with a stronger read and a larger bankroll, and the returns scale roughly with the work invested.
The product that sits at the top of all of this analytical effort is the NBA Finals, where the series-betting framework reaches its highest leverage and its most pressurised pricing. I have written through the specifics of how Finals betting differs from earlier-round series betting in my Finals betting piece next.
The Discipline of the Series-Pricing Calculation
The framework I have walked through in this piece is the same one I run on every playoff series I evaluate. Convert the prices, devig the market, compare to my own probability estimate, identify the gap. Most series produce one or two markets where my edge looks genuine. A handful produce no clear edge anywhere on the board, and those series I skip. The discipline is in being willing to skip when the math does not support a bet, rather than reaching for action because the playoff narrative is exciting.
It depends on the specific series and the operator. Series moneylines attract more recreational volume and tend to have compressed favourite prices. Correct score markets attract more analytical money and often price the individual outcomes more honestly relative to the book’s model. The right answer requires running the back-solve on the specific series. Across recent playoff seasons, roughly 25 to 30 percent of series have reached Game 7. The proportion is higher in later rounds and lower in first-round series with wide seeding gaps. The series-length 7 market often prices in a higher probability than the historical baseline because casual bettors love the all-the-way storyline.Is the series moneyline or correct score better value in the playoffs?
How often does a playoff series go seven games?
Written by the editors at nba Betting Expert.